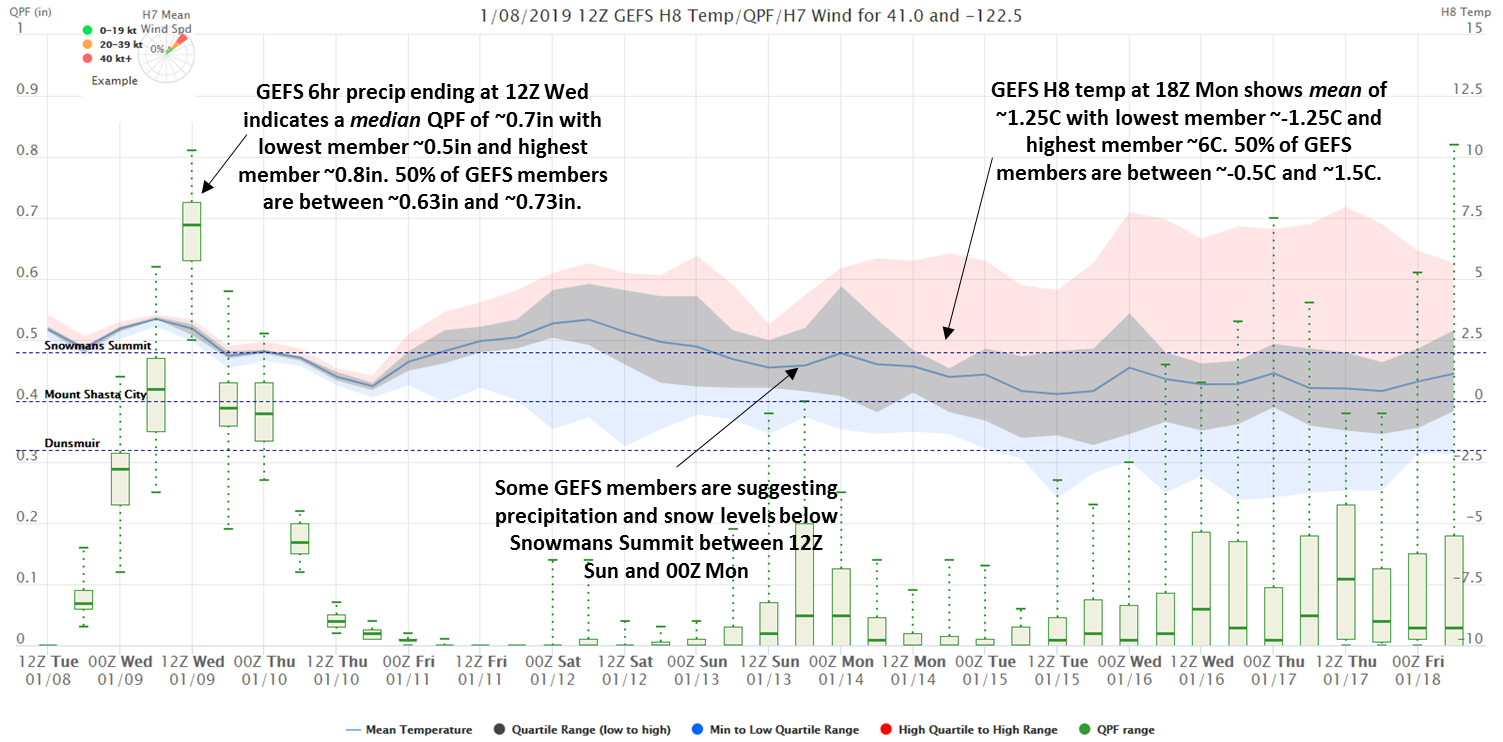
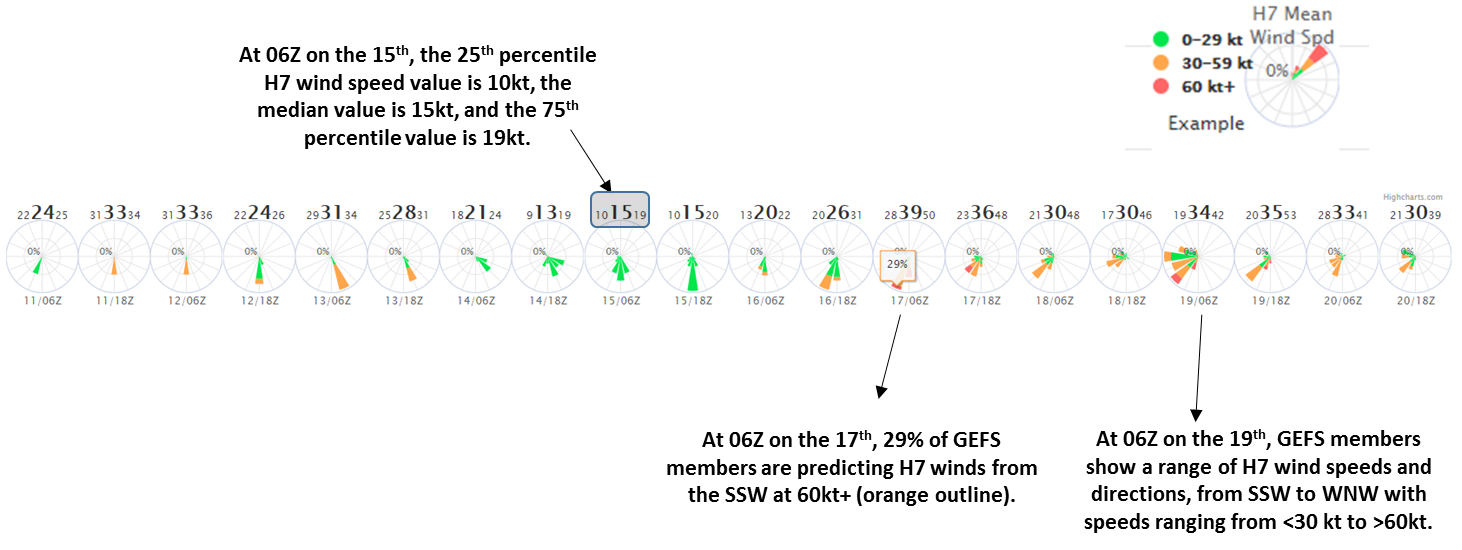
What is it: We've been working for 3 years on visualizing point GEFS data here at MFR, and we believe the imagery will be useful to other NWS offices. Therefore, we've put in some additional effort to create a dataset for the entire CONUS and make these images available on the WR web server. The imagery shows all GEFS members for every available GEFS point in the CONUS, displaying distribution of H8 temp, QPF, and H7 wind speed/direction. We can likely include other parameters, but we've found this initial suite to be very beneficial. Thickness has been recommended for a display, and we can do that, but H8 temp works well for us in most cases for helping with snow levels. We use QPF/H8 temp fixed y-axes in our CWA for continuity. However, for points outside of our CWA, I've allowed for dynamic y-axes for QPF/H8 temp...and have of course removed the dashed horizontal plotlines that show when there will be snow at key mountain passes.
Why: This effort was motivated by the GEFS AR landfall tool...and how it would be more useful if it not only showed the probabilities of significant QPF but also whether that moisture will be snow or rain at various points/elevations. Our GEFS imagery helps us quickly gauge rain/snow/wind impacts and confidence for the next 7+ days. It's also very situational-awareness-screen friendly. Eventually, I had the idea of displaying ensemble wind speed/direction spreads via wind roses. I do believe it could be helpful in fire weather situations, especially if we add H8 wind too.
Next: Add thicknesses, H8 winds, previous GEFS runs, ability to change wind thresholds...
Contact: shadkeene[at]gmail
Initial thoughts/cautions: I wasn't really accustomed to looking at multiple ensemble parameters in one viewpoint, so it is taking some time to evaluate its effectiveness. First, the resolution of the GEFS is ~50km compared to the GFS that NWS employees are accustomed to looking at is 20km (13km is raw GFS resolution). Therefore, GEFS QPF won't capture terrain effects as well as the GFS operational model. However, H8 temperatures and H7 winds should be more comparable. Next, I found myself so accustomed to relying on a single operational model output that having easy-to-view H8 ranges was very beneficial. I've found on multiple occasions that the H8 mean temp on Day 7 or so verifies superior to the operational models. It would be nice to have a running tally of this. Additionally, recently I got a chance to test this imagery out with a real atmospheric river event for the first time, and it was amazing how much spread was in the ensemble data on Day 2. This helped us message to our partners that confidence in exact location and timing of heavy rainfall was medium at best, but we had high probability that heavy rain/flooding was going to occur somewhere in our forecast area. Additionally, even when run to run operational model QPF changes were significant, GEFS output held steady with heavy median precipitation amounts at the coast, and this is what verified. Lastly, a quick look at the spread of H7 wind speed/dir can assess how uncertain the models are in the synoptic pattern ahead.

